
 Print
Print
|
|
|
|
Search Results
After performing a search, the Search Results tab is automatically selected. Defect data returned as search results is presented within the grid. Each row represents an inspection associated with a defective part based on the search criteria. Each column represents specific information about the inspection (for example, part program, inspection name, sensor, status, time stamp, etc.). Use the scroll bars to see data from a specific time period.
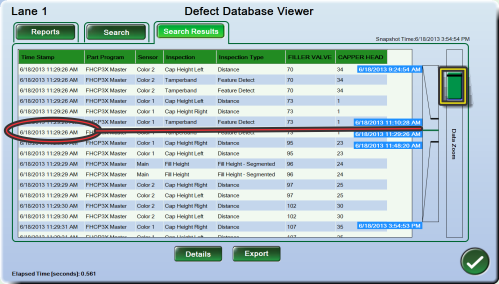
Scrolling through the data
Click the scroll bar to the immediate right of the grid to scroll to a specific record. Labels appear indicating the time stamps that will be scrolled to when moving the button next to the label. Note that the labels are spaced by records not by time.
For larger data sets (more than about 160 records) a second scrollbar “Data Zoom” appears to the right of the first scroll bar. This allows narrowing in on the time of interest. While moving the Data Zoom scroll bar two thick lines appear in the first scroll bar, which indicate the time span to which scrolling will be restricted. Labels indicate the times of the first and last record of the search result; the first and last record of the current scroll restriction selected by Data Zoom and of one currently displayed record. Use the first scroll bar to get closer to the desired time and repeat the process as needed.
Viewing result details
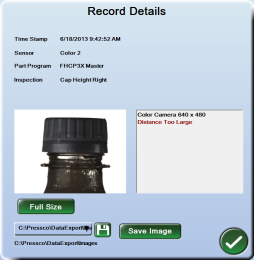
Click the Details button for a highlighted item to view the Record Details. This window displays the associated image and inspection information. It also allows you to export the image. The Full Size button brings up a viewer showing the unscaled image in full resolution (screen resolution may restrict this for images of very high resolution).
 or
or 
Note: The details viewer will not always show a specific text such as “Distance too Large.” This depends on the type of inspection and the specific type of defect.
Exporting the results
To export the results:
- Click the Export button at the bottom of the Defect Database Viewer Search Results screen. The Export Search Results window is displayed.
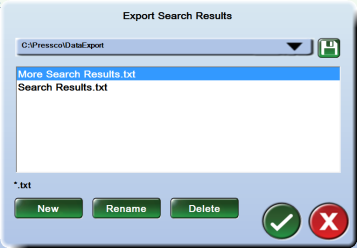
- If desired, use the disk icon to browse to a different location on the hard drive or a USB drive. Browse to the desired location and click the OK button to continue.
- Select an existing file from the displayed box, or click the New button to create a new report file name.
- (If creating a new file) In the on-screen keyboard type a file name, and click the OK button to continue. A file is created at the location displayed in the drop-down but no data is saved yet. Highlight the new file as in step 3.
- Click the OK button. The search results are saved as a text (.txt) file. You can use this data in your own spreadsheets or other databases to chart your plant's defect data. Exported Search Results Example.
In This Section |
Print
|
Published: 8/8/2013 4:45:49 PM ©2015 ACME Ltd. All rights reserved. |
|